Plotting Probe Data
The SilcsBio software provides a utility to monitor probe concentrations and excess chemical potentials (\(\mu_\mathrm{ex}\)) as a function of GCMC-MD cycle. The following python script will generate these plots:
python $SILCSBIODIR/utils/python/plot_probe_data.py --prot <Protein PDB File>

optional arguments:
  -h, --help           show this help message and exit
  --prot PROT          protein PDB file (Required)
  --numsys NUMSYS      number of runs (Default=10)
  --halogen HALOGEN    halgen probes True/False (Default=False)
  --begin BEGIN        first gcmc-md cycle (Default=1)
  --end END            number of gcmc-md cycles (Default=100)
  --vertical VERTICAL  plot together vertically/horizontally (Default=False)
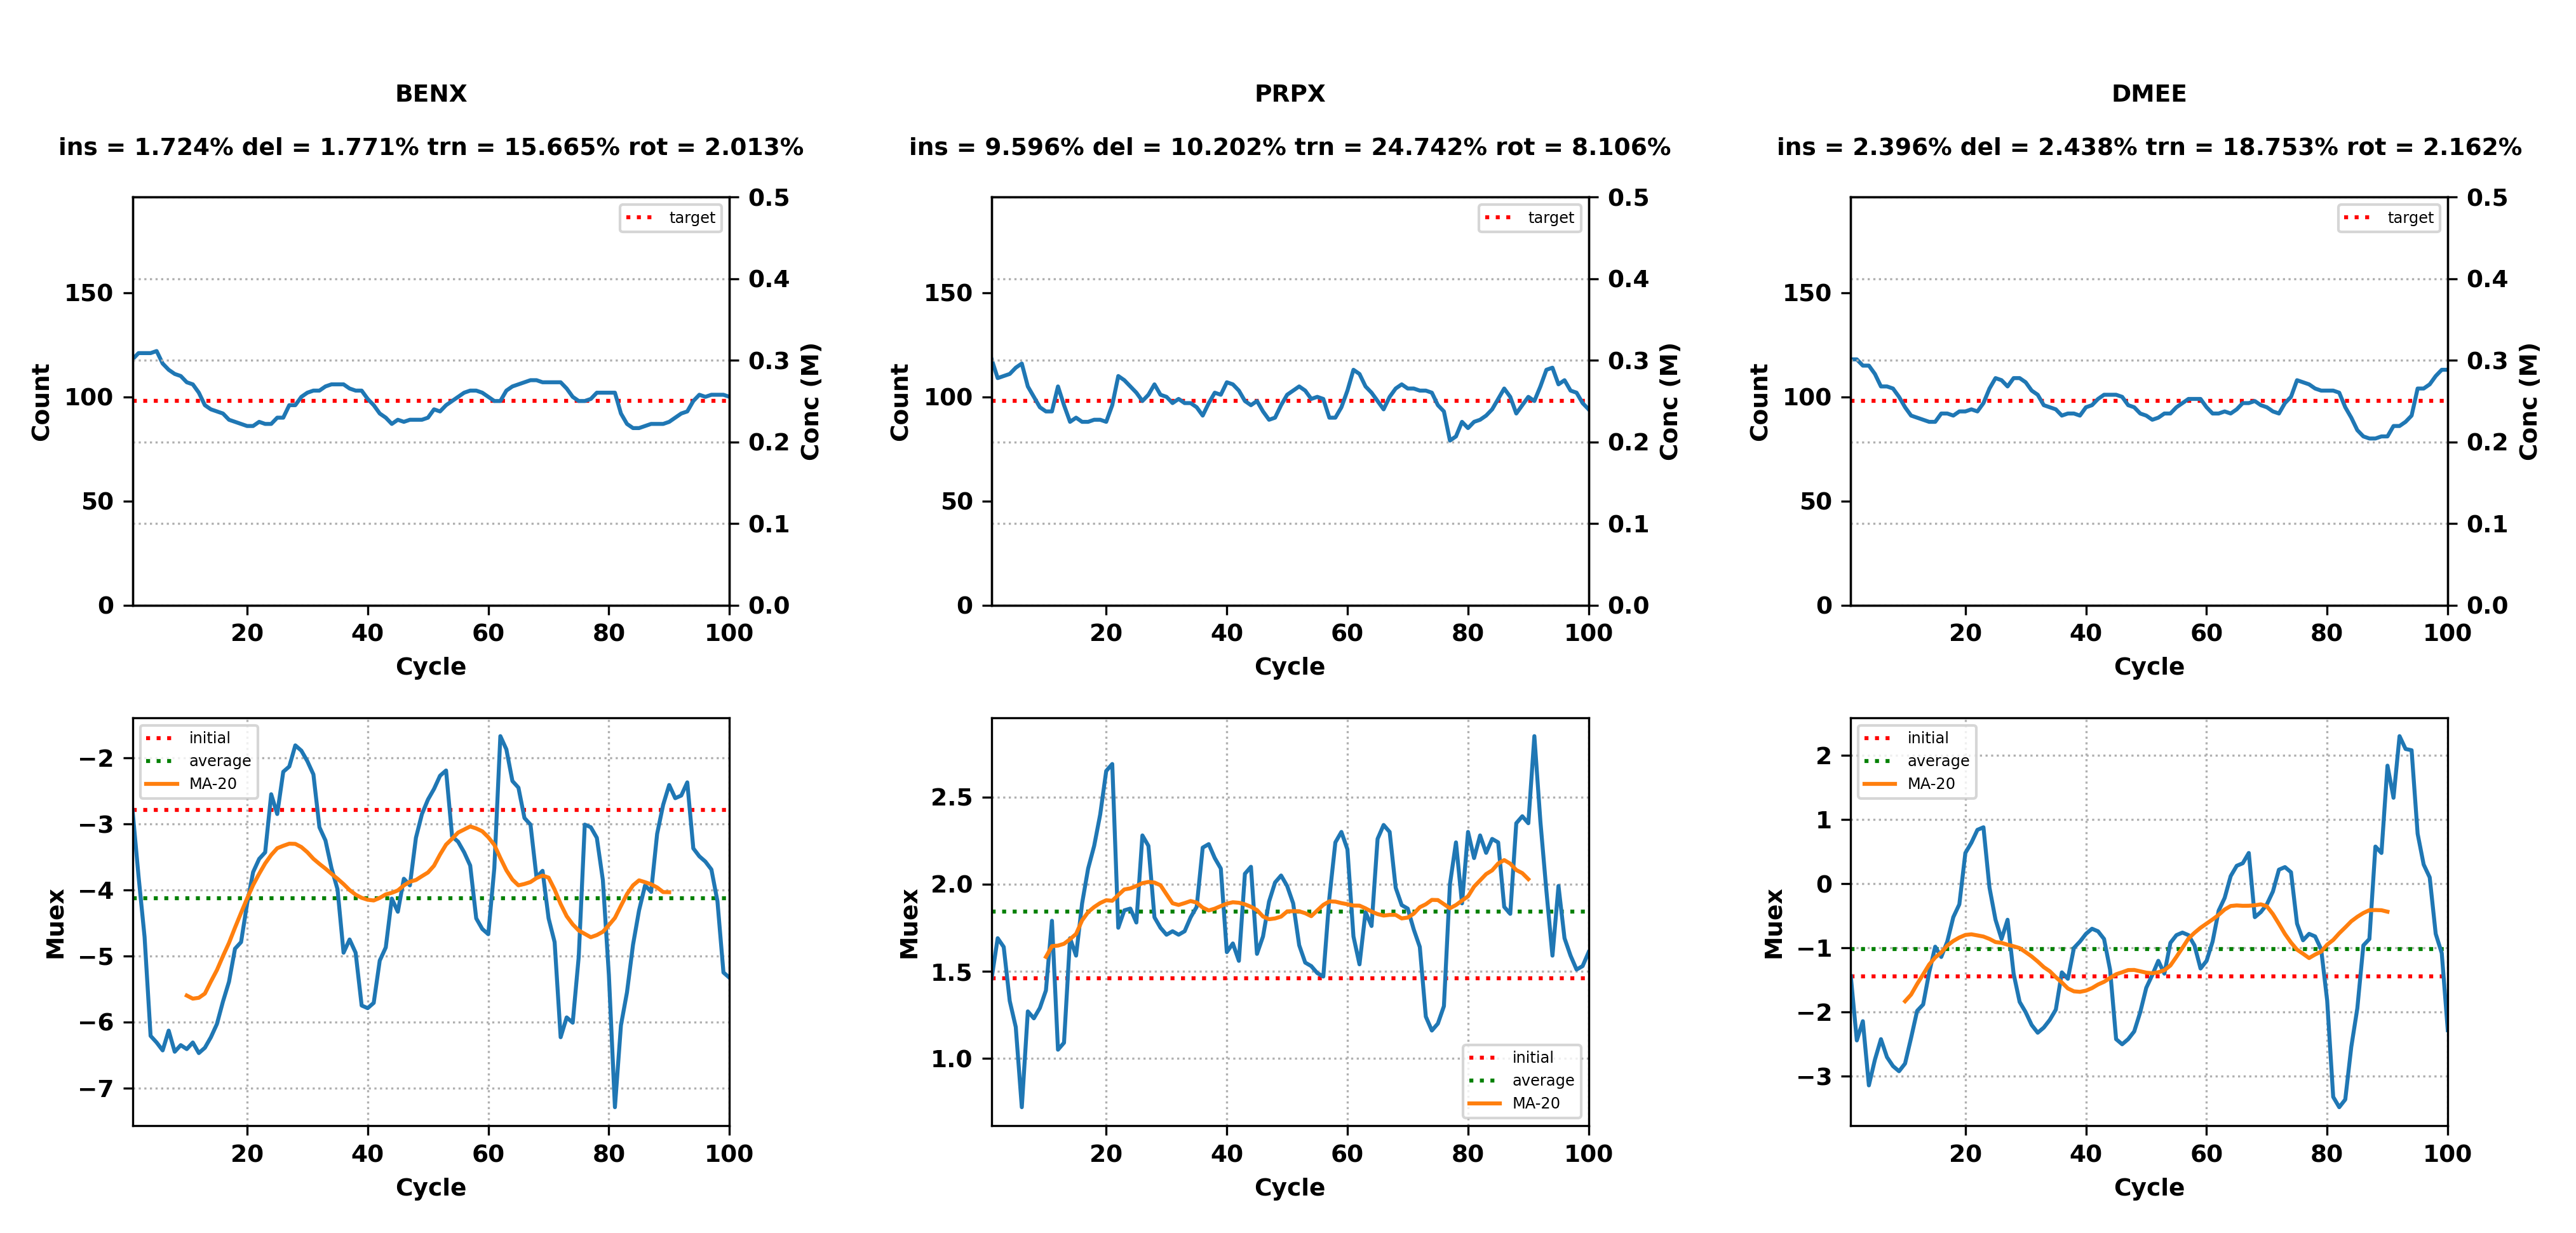
Below is an example of an output from running the python script:
1 BENX Acceptance: ins = 1.724% del = 1.771% trn = 15.665% rot = 2.013%
1 PRPX Acceptance: ins = 9.596% del = 10.202% trn = 24.742% rot = 8.106%
1 DMEE Acceptance: ins = 2.396% del = 2.438% trn = 18.753% rot = 2.162%
1 MEOH Acceptance: ins = 1.014% del = 1.037% trn = 13.012% rot = 0.680%
1 FORM Acceptance: ins = 0.772% del = 0.809% trn = 14.391% rot = 0.639%
1 IMIA Acceptance: ins = 1.183% del = 1.211% trn = 8.683% rot = 0.664%
1 ACEY Acceptance: ins = 1.453% del = 1.496% trn = 4.402% rot = 0.644%
1 MAMY Acceptance: ins = 3.865% del = 4.031% trn = 8.300% rot = 2.009%
1  SOL Acceptance: ins = 0.505% del = 0.506% trn = 10.704% rot = 1.026%
The output lists the SILCS simulation number, SILCS solute, and the accepted
insertions (ins), deletions (del), translations (trn), and
rotations (rot).
A detailed output for each simulation system will be stored in status.<system number>.txt
text file in the 2a_run_gcmd directory. An example of the contents of
status.<system number>.txt is shown below:
 cycle fragname   curr_N   targ_N  percent        hfe     muexdx      vardx       dxdx       muex
   1     benx      118       98   120.41     -0.790      1.000      0.000      0.000     -2.790
   1     prpx      118       98   120.41      1.960      0.500      0.000      0.000      1.460
   1     dmee      118       98   120.41     -1.440      1.000      0.000      0.000     -1.440
   1     meoh      118       98   120.41     -5.360      2.000      0.000      0.000     -5.360
   1     form      118       98   120.41    -10.920      2.500      0.000      0.000    -10.920
   1     imia      118       98   120.41    -14.180      3.000      0.000      0.000    -14.180
   1     acey      118       98   120.41    -97.310     10.000      0.000      0.000    -97.310
   1     mamy      118       98   120.41    -68.490      7.000      0.000      0.000    -68.490
   1      sol    21750    21750   100.00     -5.600      0.500      0.000      0.000     -5.600
   2     benx      121       98   123.47     -0.790      1.000     -0.920     -0.300     -3.790
   2     prpx      109       98   111.22      1.960      0.500     -0.220      0.450      1.690
   2     dmee      118       98   120.41     -1.440      1.000     -1.600     -0.000     -2.440

...

  99     imia      100       98   102.04    -14.180      3.000     -0.240      0.000     -7.160
  99     acey      109       98   111.22    -97.310     10.000      0.000      1.000    -95.310
  99     mamy      104       98   106.12    -68.490      7.000      0.000      0.700    -83.890
  99      sol    21818    21750   100.31     -5.600      0.500     -0.031      0.000     -6.071
 100     benx      100       98   102.04     -0.790      1.000     -0.080      0.000     -5.330
 100     prpx       94       98    95.92      1.960      0.500      0.080      0.000      1.610
 100     dmee      113       98   115.31     -1.440      1.000     -1.200     -0.000     -2.280
 100     meoh      107       98   109.18     -5.360      2.000     -0.720     -0.400     -3.600
 100     form       98       98   100.00    -10.920      2.500      2.500      0.000     -8.820
 100     imia      109       98   111.22    -14.180      3.000     -1.320     -2.700    -11.180
 100     acey      106       98   108.16    -97.310     10.000     -3.200      3.000    -95.510
 100     mamy      105       98   107.14    -68.490      7.000     -1.960     -0.700    -86.550
 100      sol    21793    21750   100.20     -5.600      0.500     -0.020      0.000     -6.090
In the status.<system number>.txt file, each row corresponds to a given solute
molecule in a given cycle. In each row, the following information is provided:
the cycle (
cycle),SILCS solute (
fragname),number of the solute molecule in the cycle (
curr_N),targeted number of the solute molecule (
targ_N),the percent number of the solute molecule over the targeted number of that solute molecule (
percent),the approximate hydration free energy in kcal/mol of the solute obtained from free energy perturbation simulations (
hfe) [10],the estimated magnitude of excess chemical potential variation (
muexdx),the standard variation in excess chemical potential (
vardx),the instantaneous variation in the excess chemical potential (
dxdx), andthe excess chemical potential (
muex).
More information on GCMC cycles and each variable is available in reference [27].
In addition, the python script will produce plots as .png files for each probe in
each simulation system. These plots will be stored in 2a_run_gcmd/acceptance_analysis/
as count.<protein PDB name>.<system number>.png. Below is an example of the output
plots: