FragMap Visualization
Visualizing SILCS FragMaps
Whether you used the SilcsBIO GUI or the 2c_fragmap command line
utility to create SILCS FragMaps from your SILCS simulation trajectories,
you will have a folder silcs_fragmap_<protein PDB>/maps that
contains SILCS grid free energy (GFE) FragMaps for you system.
SILCS FragMaps are defined using non-hydrogen atoms, and for certain solute
types (imidazole, formamide) there are multiple FragMaps. FragMaps for water
oxygen atoms (tipo) are created to identify water molecules that can be
difficult to displace. Generic FragMaps for apolar (benzene+propane),
H-bond donor (neutral H-bond donors), and H-bond acceptor (neutral
H-bond acceptors) probe types are included to simplify visual analysis.
The easiest way to visualize FragMaps is with the SilcsBio GUI. SilcsBio also provides convenient FragMap visualization using MOE, PyMOL, and VMD.
FragMaps in the SilcsBio GUI
If you have used the SilcsBio GUI to run your SILCS simulations, once the simulations are complete, you will click the “Generate FragMap” button to automatically create FragMaps from the SILCS simulations, download them onto your local computer, and load them, along with the input PDB file, for visualization. Alternatively, you can load SILCS FragMaps from the Home page of the SilcsBio GUI:

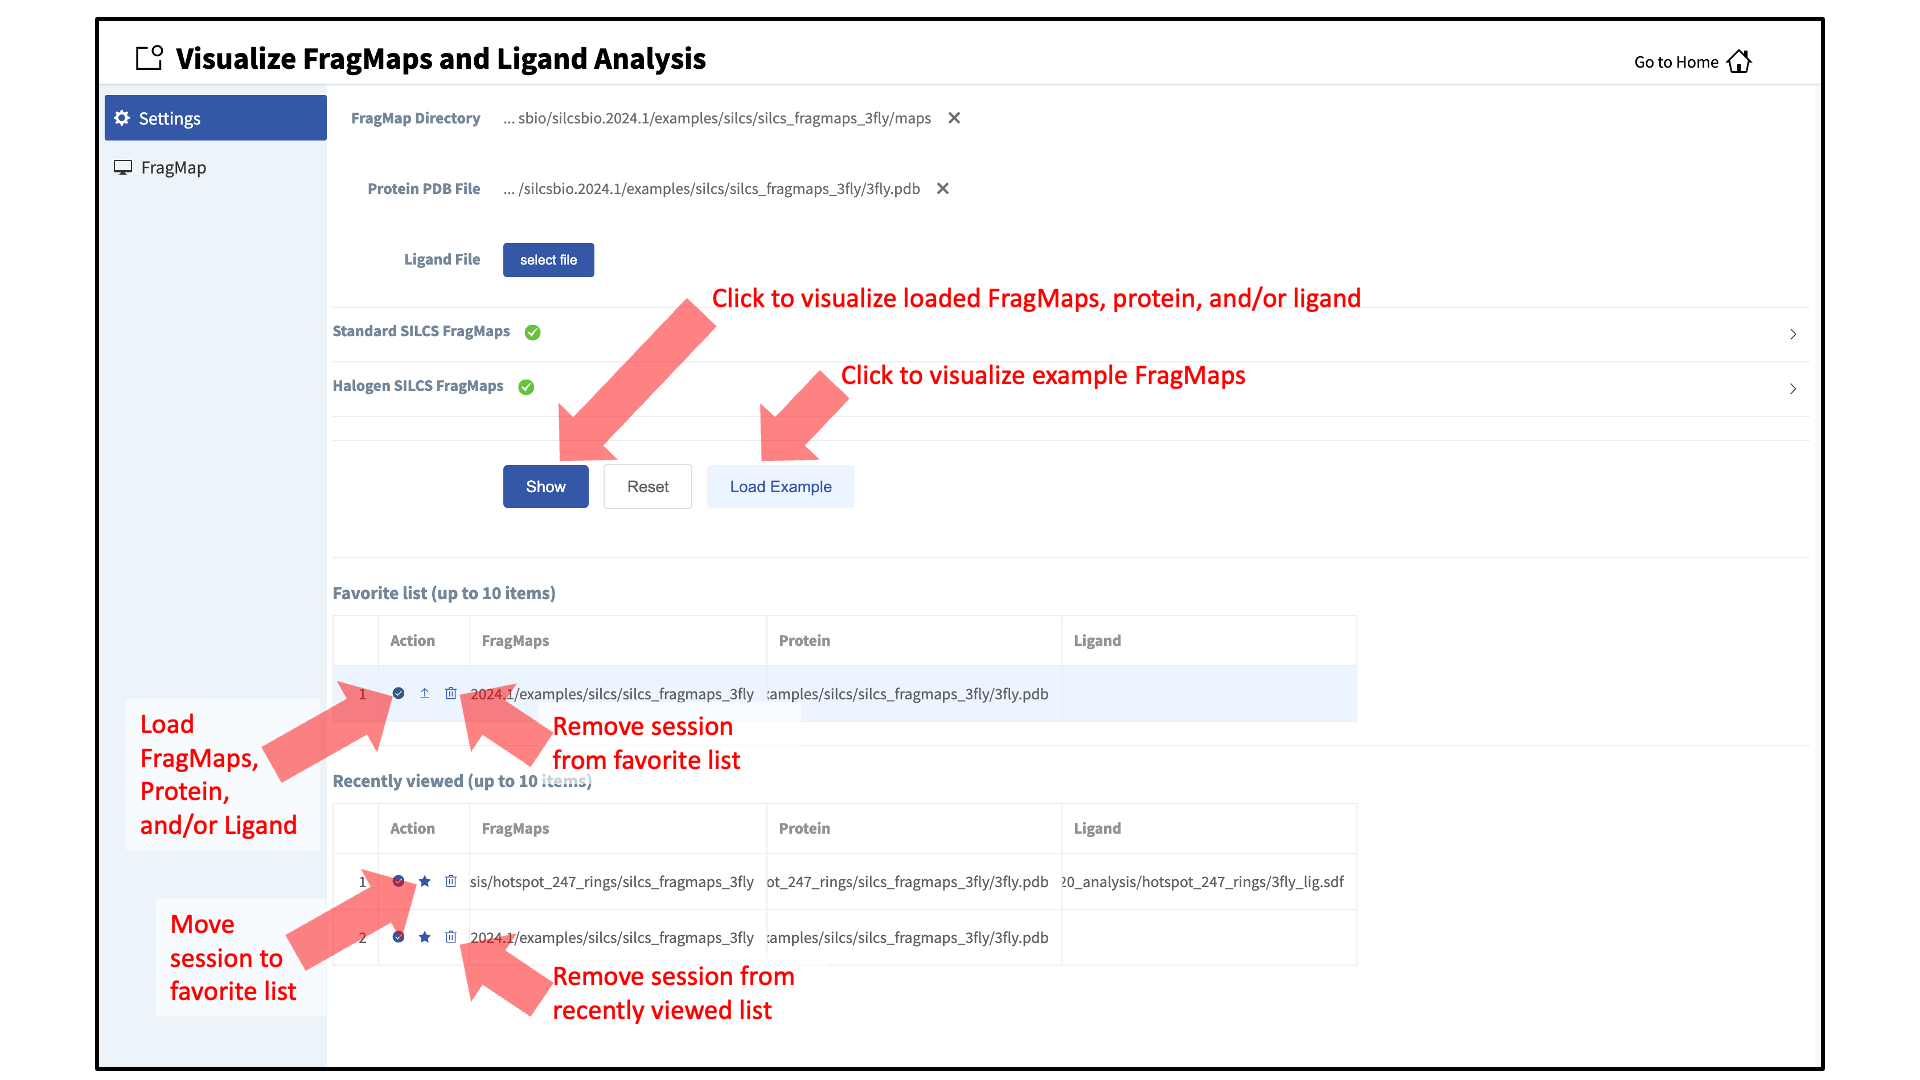
If you are loading SILCS FragMaps from the Home page, you will be asked
to select your FragMap directory (see File and Directory Selection).
This directory has a standard name, silcs_fragmaps_<protein PDB>, where
<protein PDB> is the name of the input PDB file. This directory was
created on the server where you ran the SILCS jobs either when you clicked
the “Generate FragMap” button or when you ran the
${SILCSBIODIR}/silcs/2c_fragmap prot=<protein PDB> command.
Alternatively, previously viewed visualization sessions may also be loaded by clicking on the checkmark next to the desired session under “Action”. The ten most recently viewed visualization sessions will be listed under “Recently viewed”. Frequently viewed sessions can be saved under the “Favorite list” by clicking on the star icon next to the session under “Action”. Additionally, extraneous sessions can be removed by clicking on the trash icon next to the session under “Action”.
Note
In addition to the FragMaps, the silcs_fragmaps_<protein PDB>
directory contains the PDB file used to run the SILCS simulations.
The SilcsBio GUI will automatically detect and load this PDB file.
Additionally, if you have run Halogen SILCS, this directory will also
contain the Halogen SILCS FragMaps, which will be automatically
detected and loaded by the GUI.
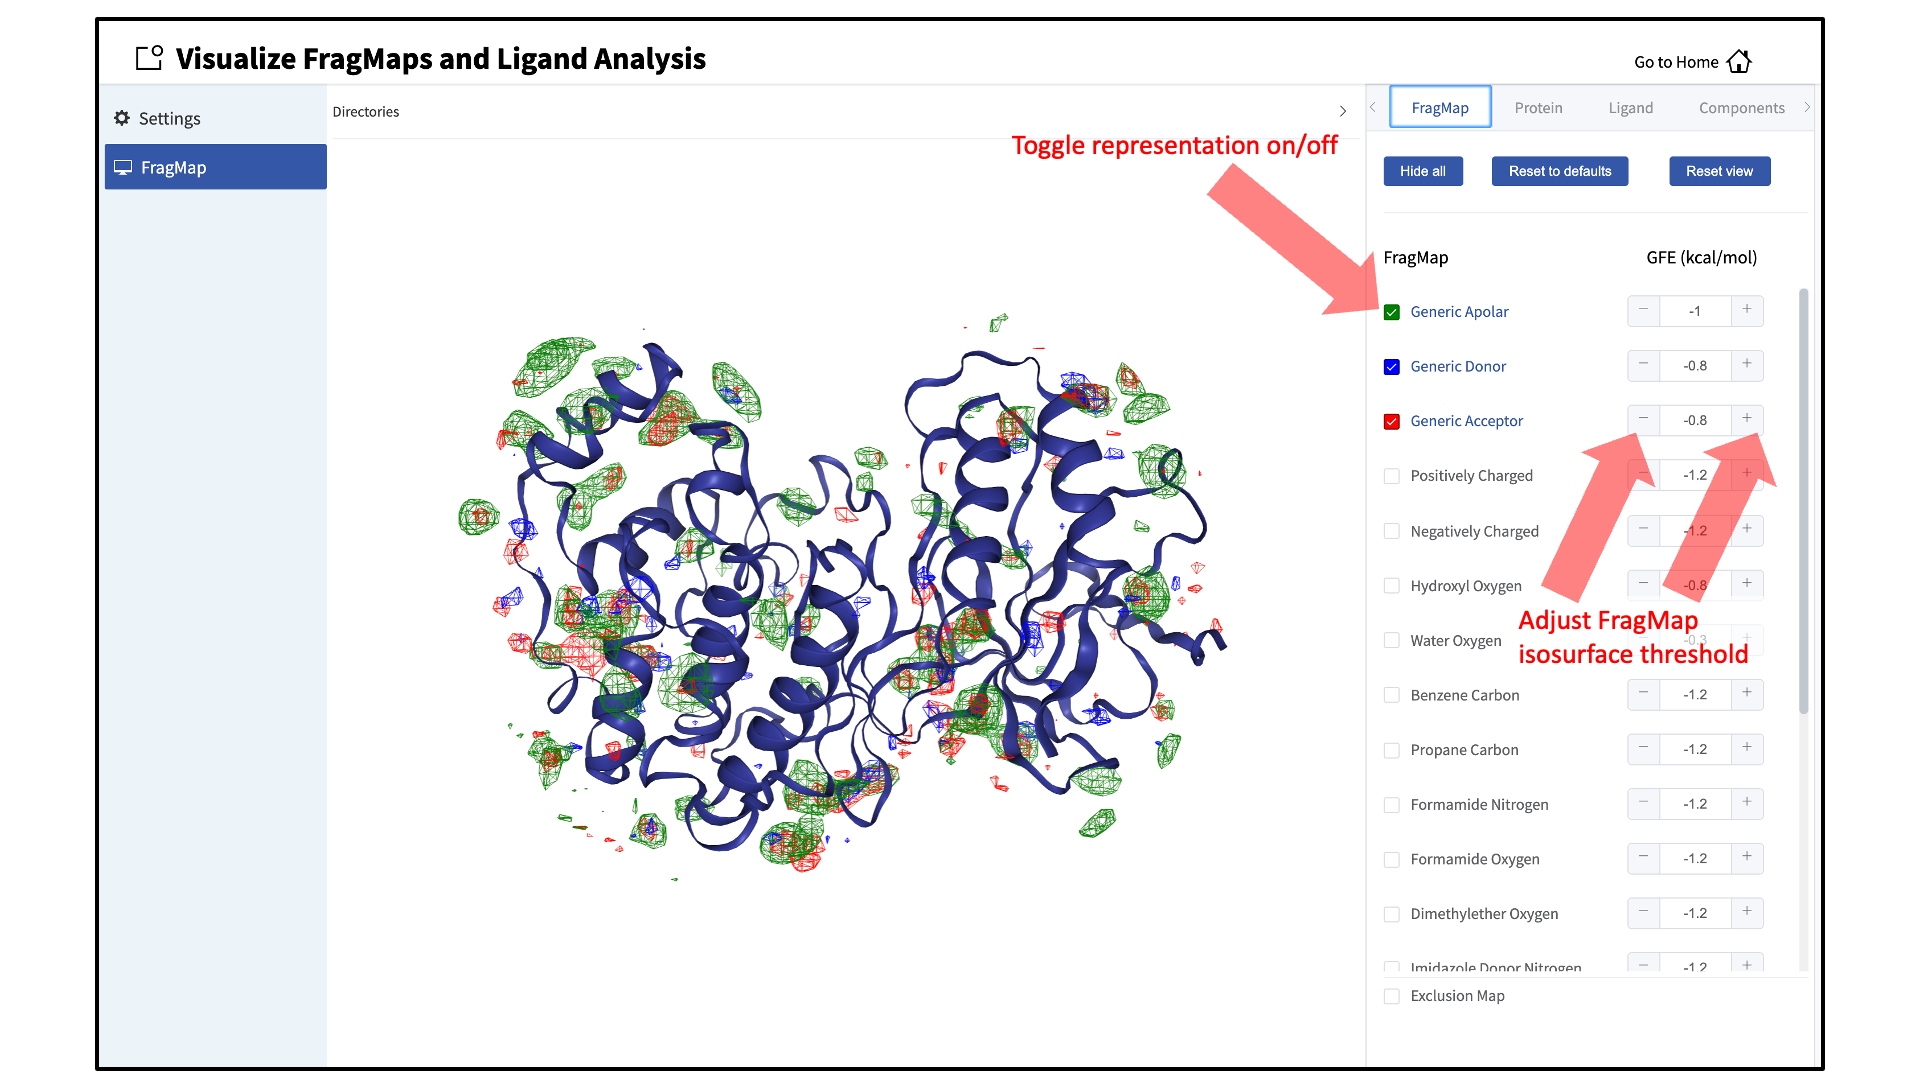
Once loaded, the FragMaps and protein will be displayed with default settings. In the default settings, the protein is shown in cartoon representation and generic apolar, generic donor, and generic acceptor FragMaps are shown in green, blue, and red wire representation.
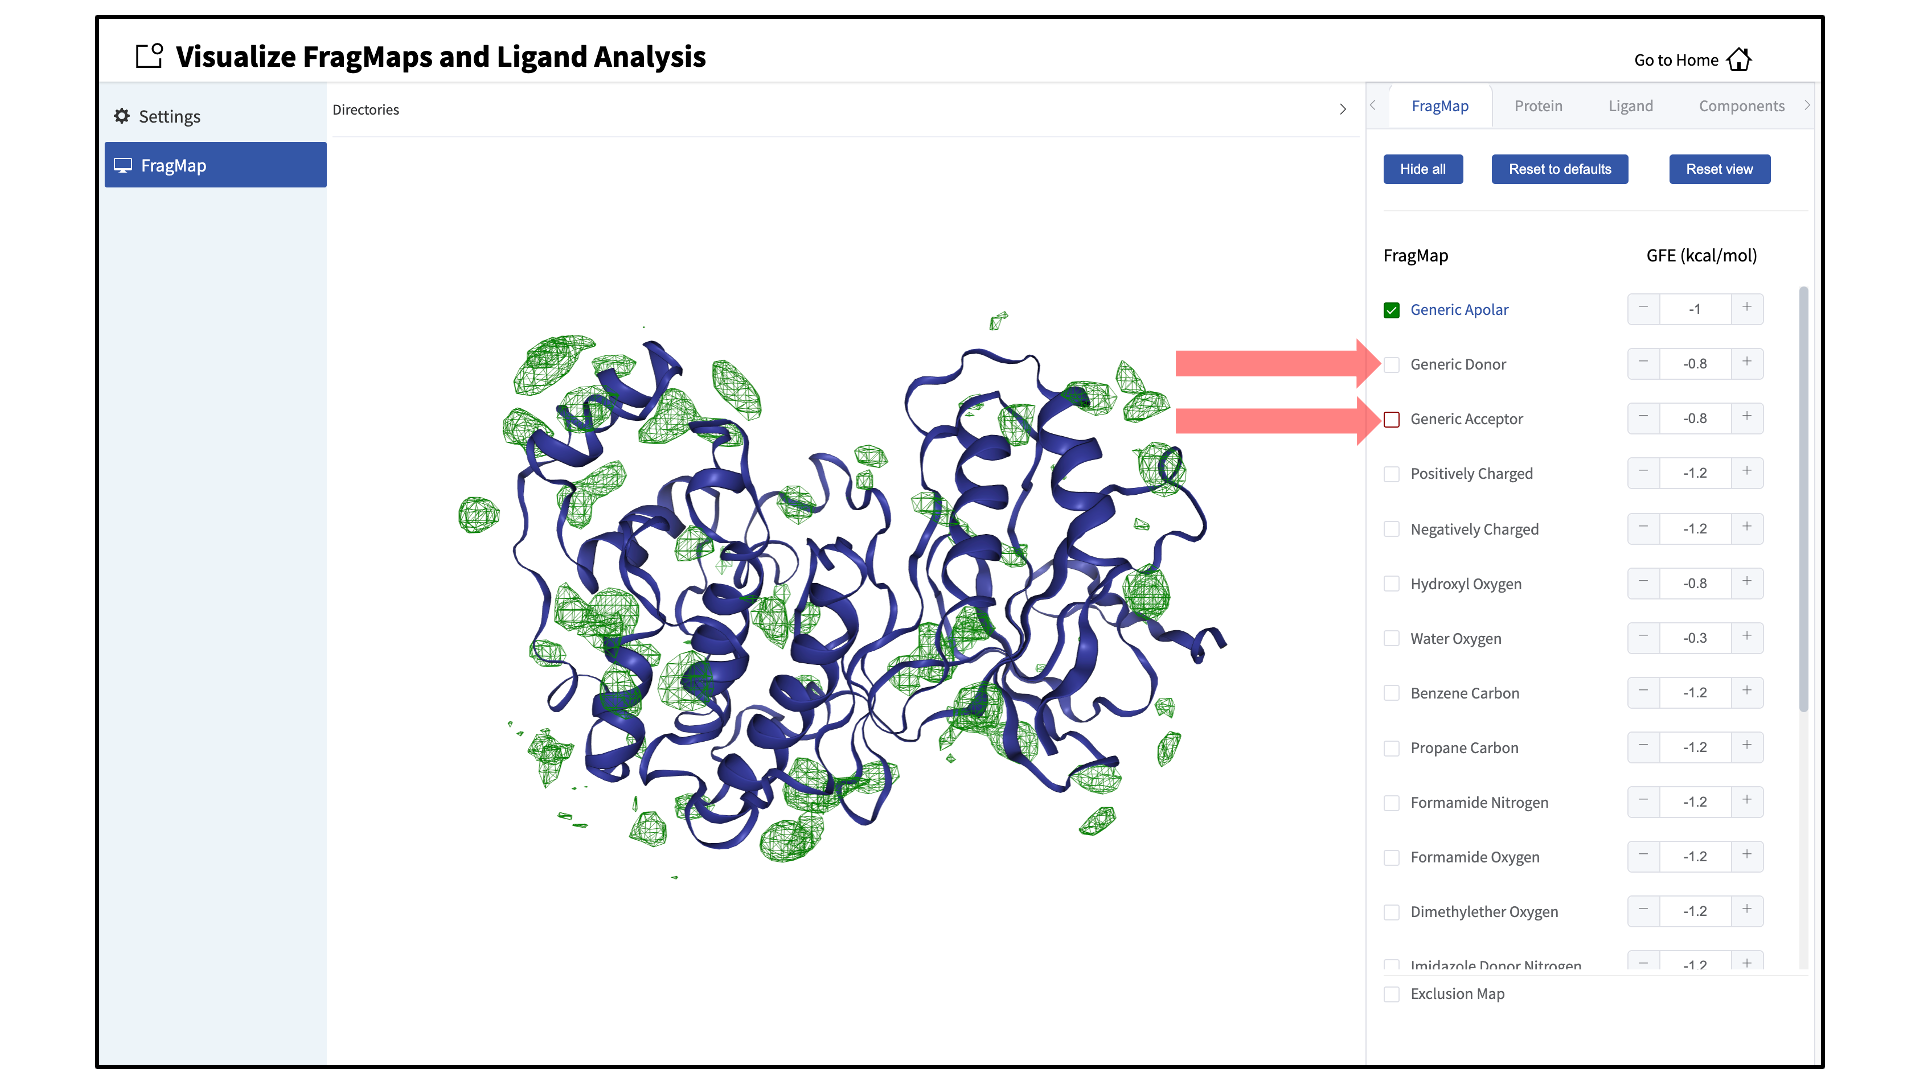
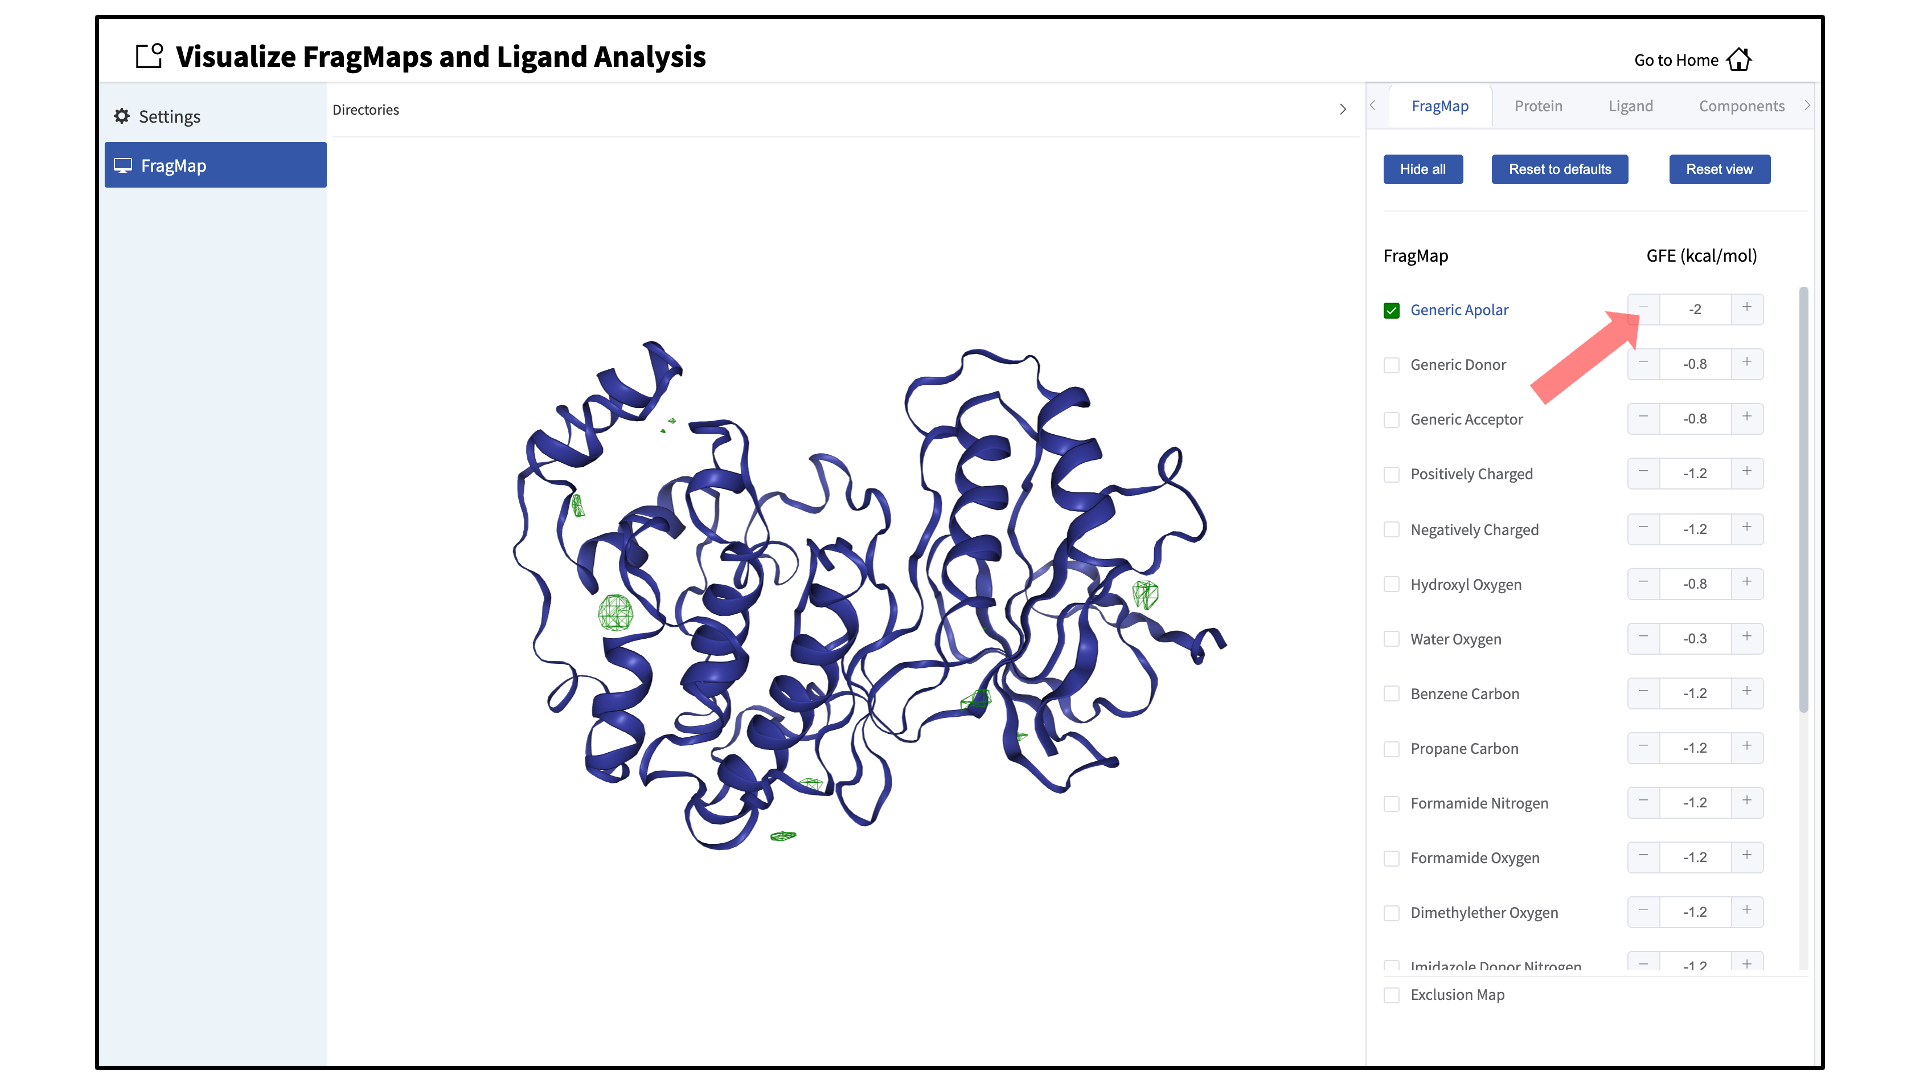
FragMaps can be toggled on and off by clicking the checkbox adjacent to the desired FragMap. Additionally, the FragMap GFE isosurface threshold can be increased or decreased using the + or - buttons. The default FragMap visibilities and FragMap GFE isosurface threshold cutoffs can be restored by clicking on the Reset to defaults button. The standard and halogen FragMaps and their associated probe atoms are listed in the tables below.
FragMap Name |
FragMap Color |
Component Name |
Associated Probe Atom(s) |
|---|---|---|---|
Generic Apolar |
Green |
apolar |
Generic Apolar Carbons (benc+prpc) |
Generic Donor |
Blue |
hbdon |
Generic Hydrogen Bond Donors (forn+iminh) |
Generic Acceptor |
Red |
hbacc |
Generic Hydrogen Bond Acceptors (foro+dmeo+imin) |
Positively Charged |
Cyan |
mamn |
Methylamine Nitrogen |
Negatively Charged |
Orange |
acec |
Acetate Carboxylate Carbon |
Hydroxyl Oxygen |
Tan |
meoo |
Methanol Oxygen |
Water Oxygen |
Black |
tipo |
Water Oxygen |
Benzene Carbon |
Purple |
benc |
Benzene Carbons |
Propane Carbon |
Lime Green |
prpc |
Propane Carbon |
Formamide Nitrogen |
Blue |
forn |
Formamide Nitrogen |
Formamide Oxygen |
Red |
foro |
Formamide Oxygen |
Dimethylether Oxygen |
Red |
dmeo |
Dimethylether Oxygen |
Imidizole Donor Nitrogen |
Blue |
iminh |
Imidizole Nitrogen (h-bond donor) |
Imidizole Acceptor Nitrogen |
Red |
imin |
Imidizole Nitrogen (h-bond acceptor) |
FragMap Name |
FragMap Color |
Component Name |
Associated Probe Atom(s) |
|---|---|---|---|
Fluorbenzene |
Blue |
flbc |
Fluorbenzene Fluorine |
Chlorobenzene |
Pink |
clbx |
Chlorobenzene Chlorine |
Bromobenzene |
Brown |
brbx |
Bromobenzene Bromine |
Chloroethane |
Green |
clex |
Chloroethane Chlorine |
Fluoroethane |
Green |
fetx |
Fluoroethane Fluorine |
Trifluoroethane |
Green |
tfec |
Trifluoroethane Carbon Bonded to Fluorines |
The FragMap with the name “Exclusion Map” (component name “excl”) is a special case. The SILCS Exclusion Map enumerates all voxels where no probe molecule (including water) sampling occurred.
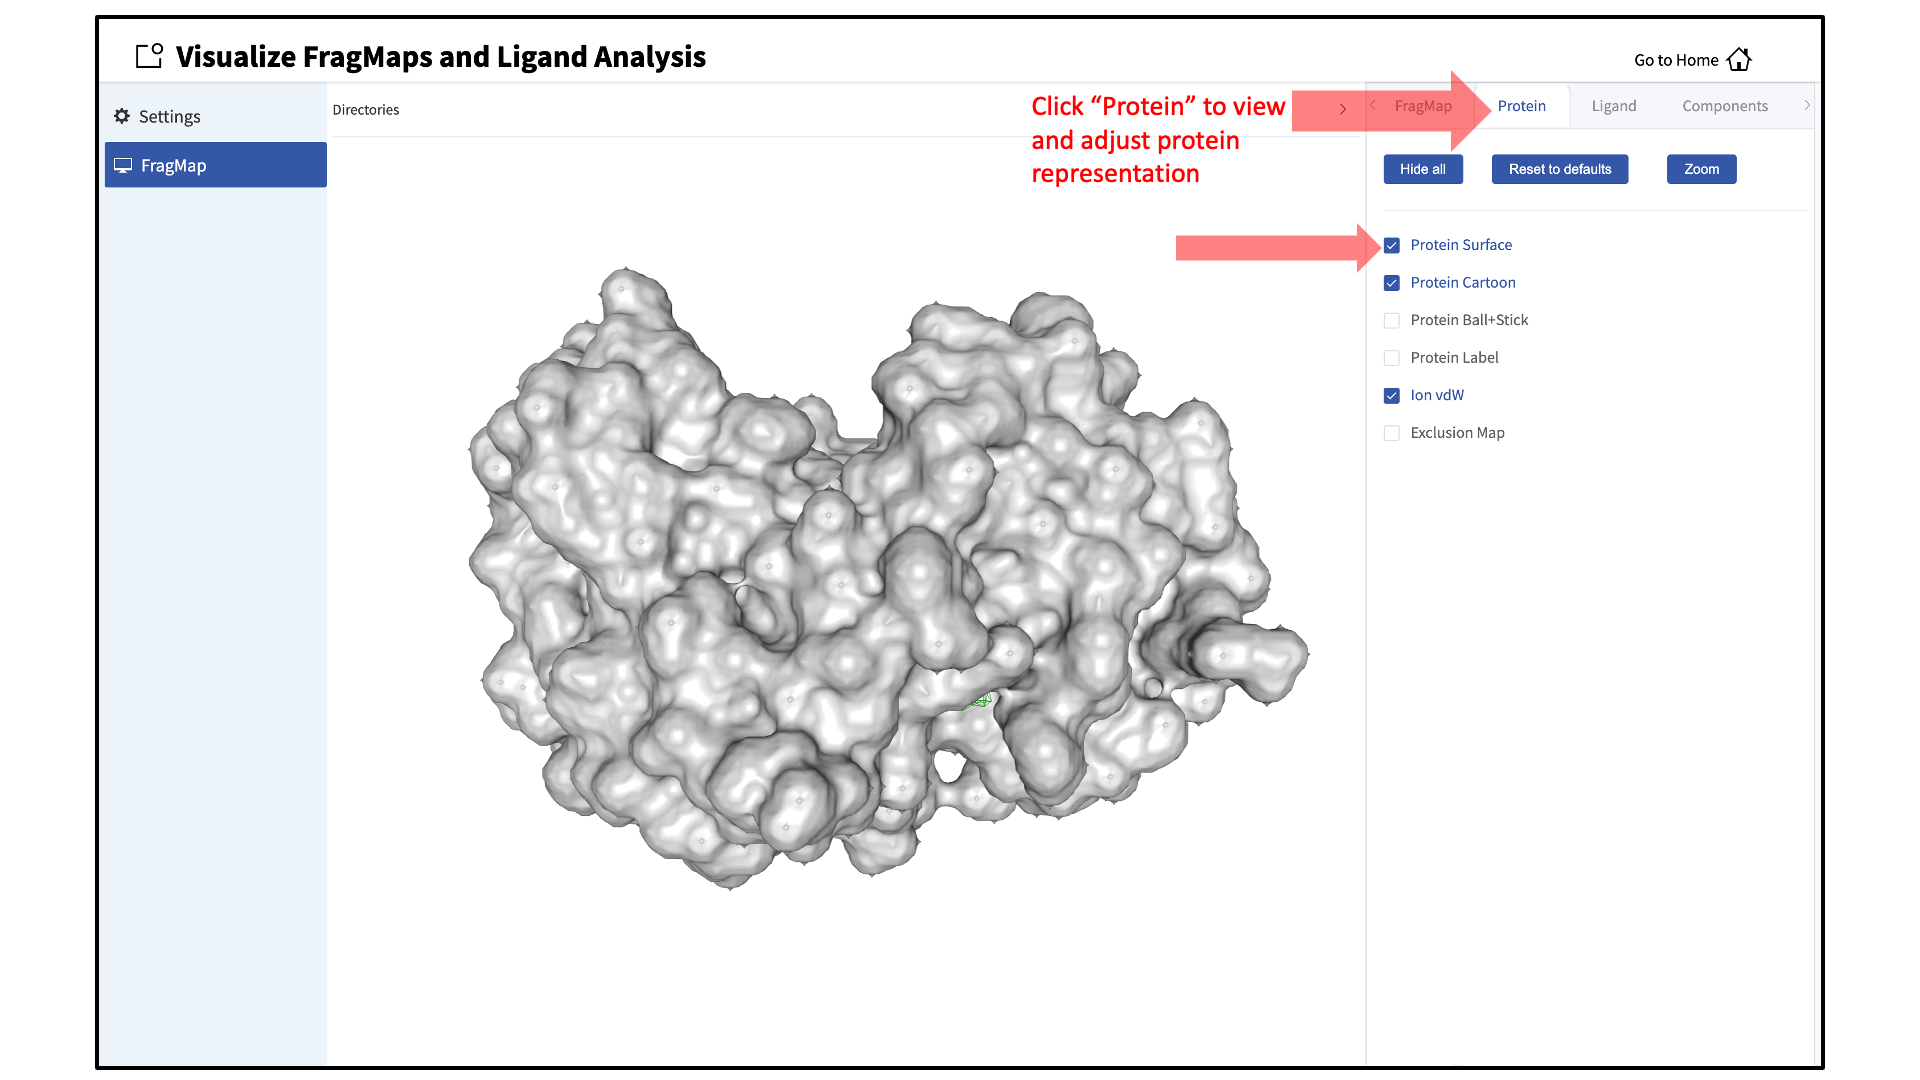
The representation of the protein can also be adjusted by clicking the “Protein” tab of the sidebar menu and toggling on or off the desired protein representations. The default protein representation can be restored by clicking on the Reset to defaults button.
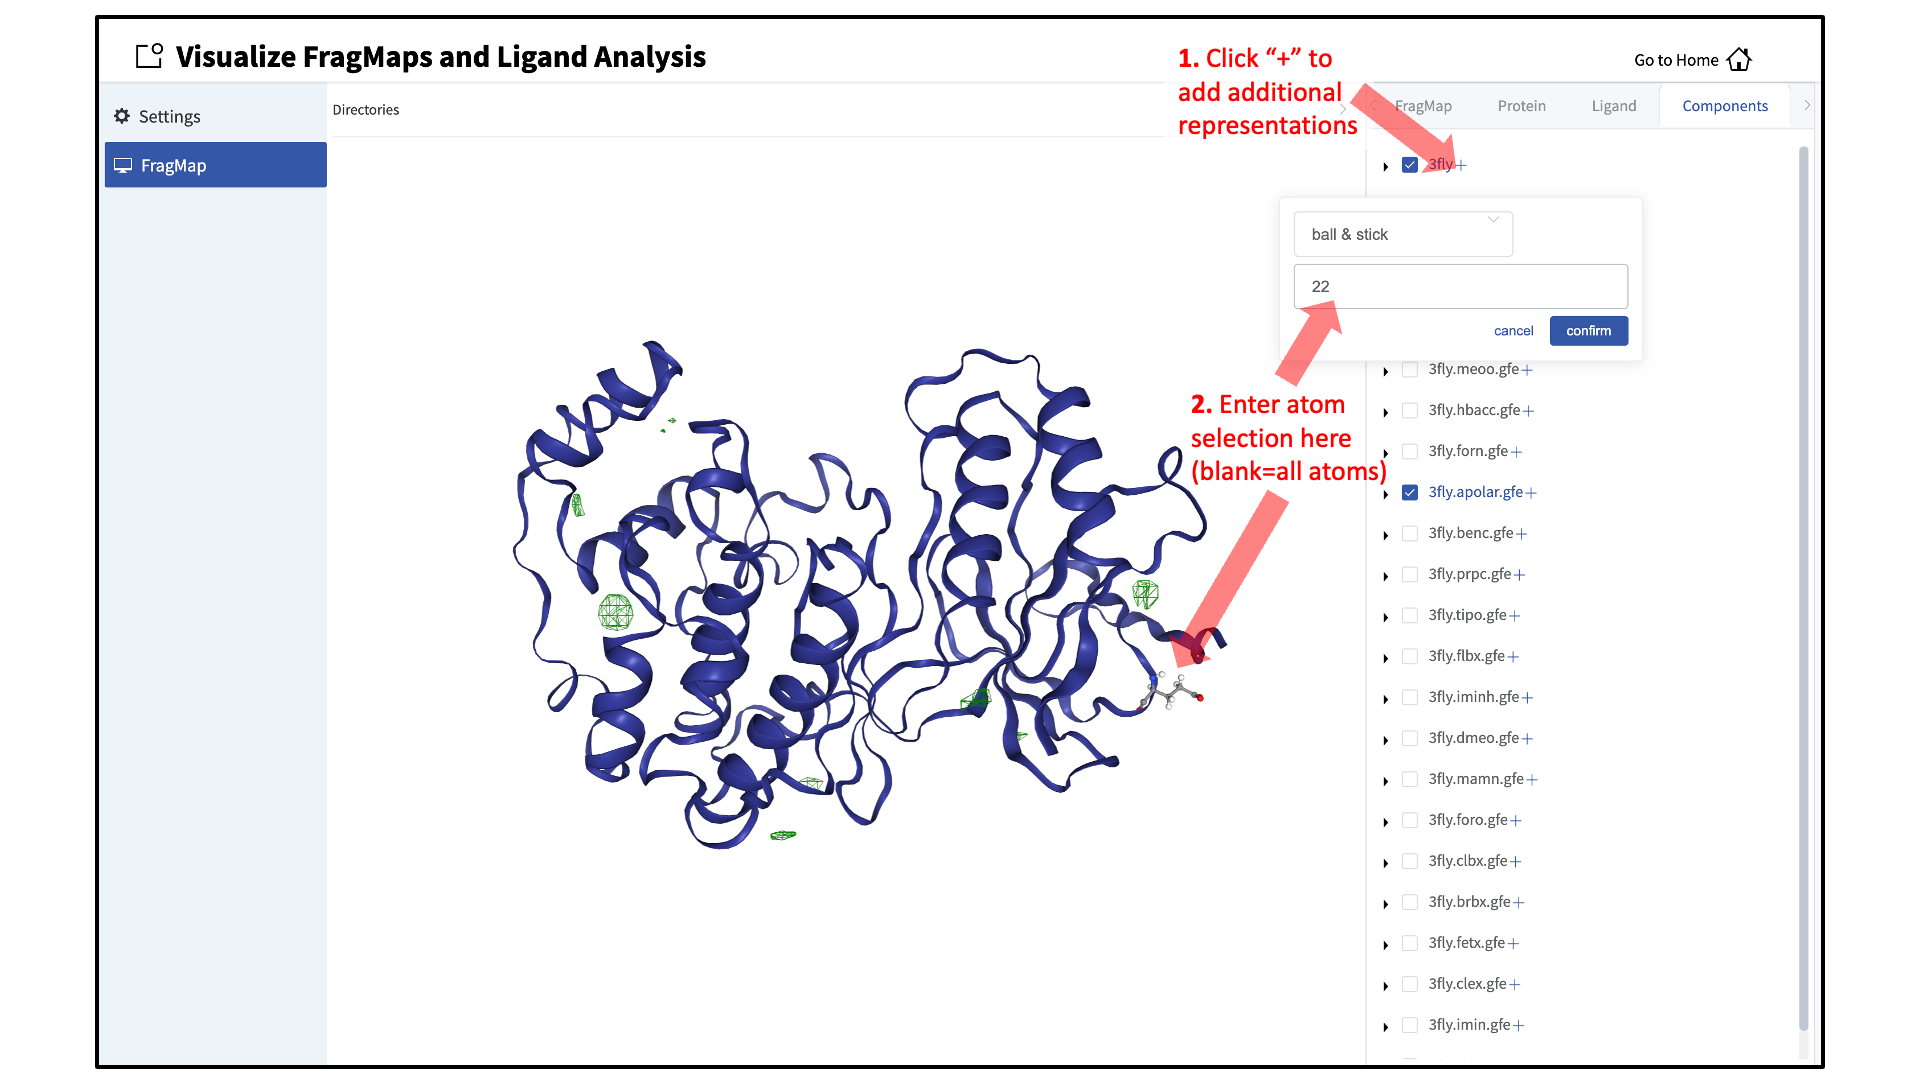
When adding an additional representation, the default is to apply it to all atoms. It is possible to apply it to only a select set of atoms by clicking the “Components” tab of the sidebar menu, clicking the + adjacent to the protein structure name, and typing the atom selection in the blank box above the “cancel” and “confirm” buttons. The selection syntax is the same as for the NGL molecular structure viewer (see Atom Selection in the SilcsBio GUI).
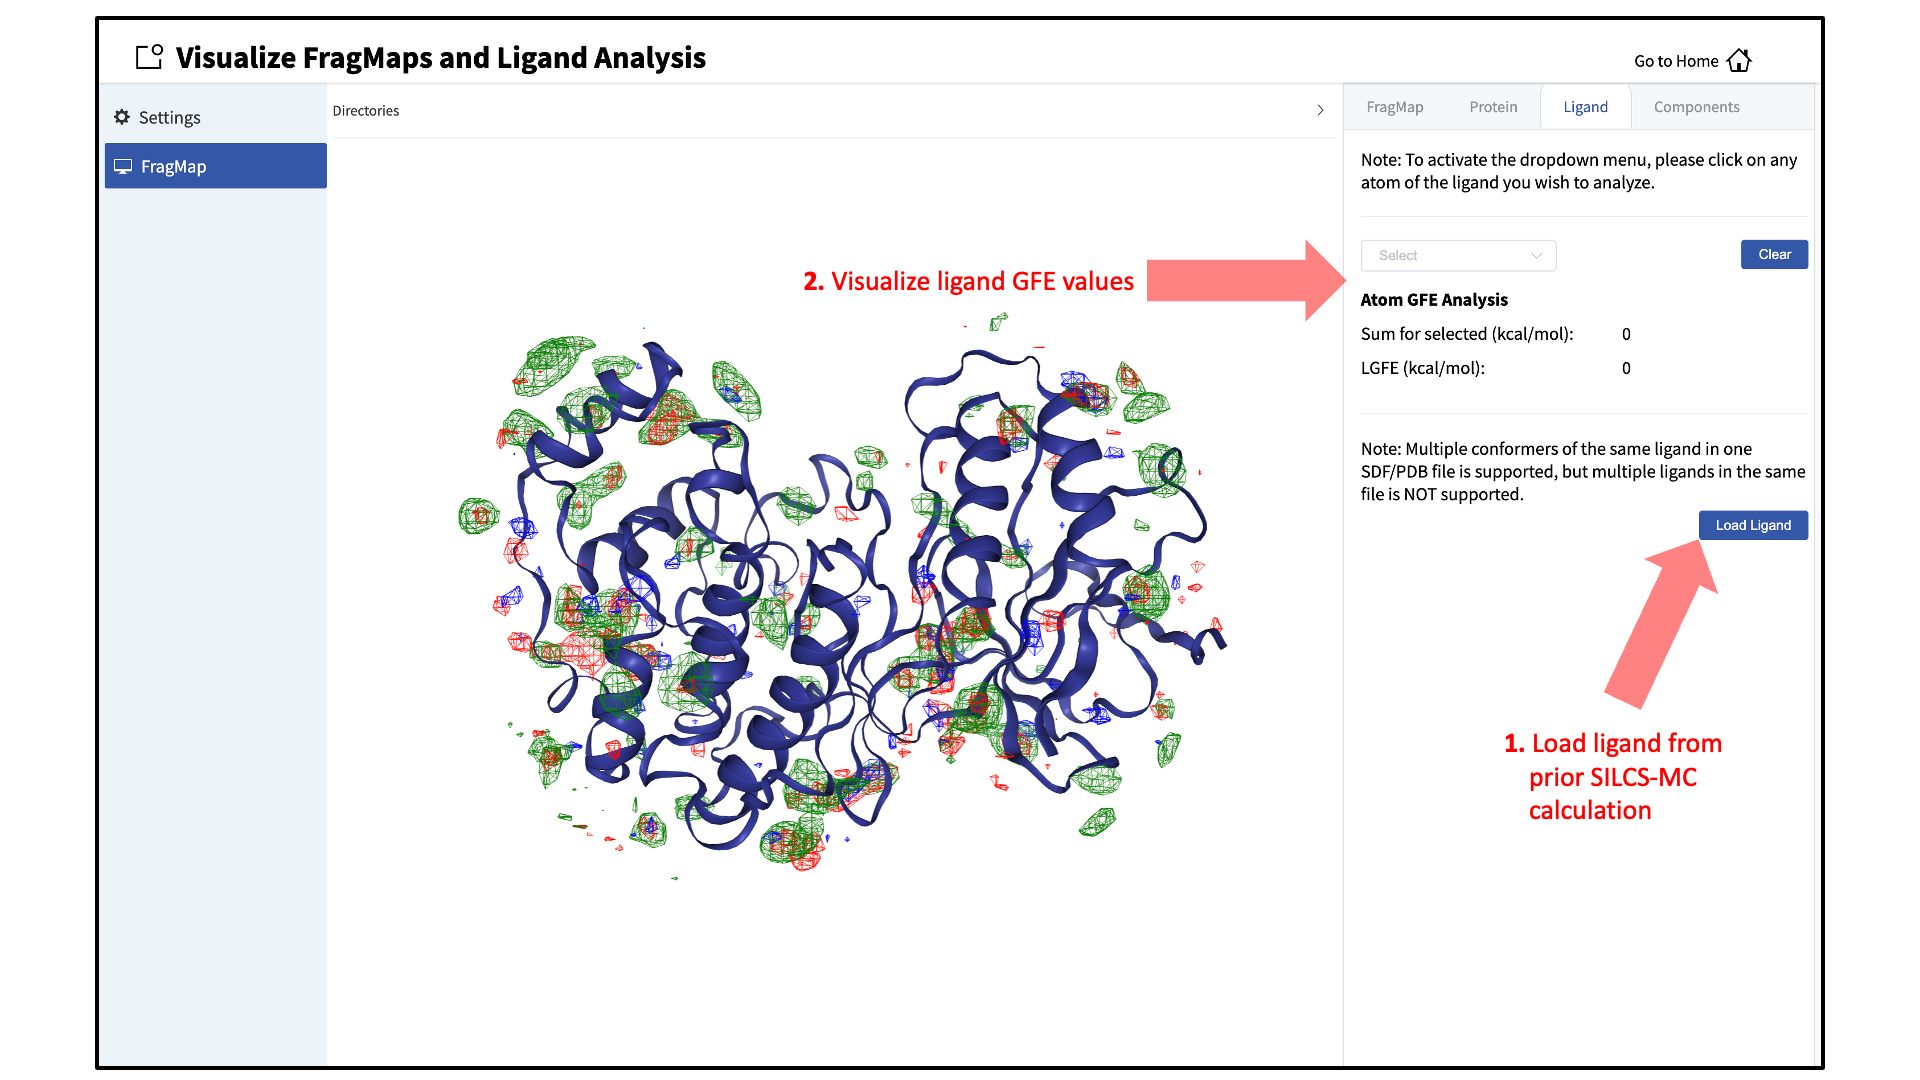
It is also possible to load ligands for visualization. If the ligand file was the output of a SILCS-MC calculation, GFE values for the ligand atoms will be embedded within that file. These values can be visualized and their sum automatically computed by first loading the ligand file, and then using the “GFE” tab as detailed at the end of the section SILCS-MC Ligand Optimization Using the SilcsBio GUI.
FragMaps in MOE
To visualize your SILCS FragMaps with MOE, first create FragMaps in the
MOE-readable CNS format. For this example, if your jobs ran on your
server in the directory ~/silcsbio/projects/silcs.5tGP:
cd ~/silcsbio/projects/silcs.5tGP
$SILCSBIODIR/silcs/2c_fragmap prot=<protein PDB> cns=true
Note
This step is required ONLY for visualization with MOE. CNS format grid files are approximately 10x the size of the default-format grid files generated and used by your SilcsBio software. PyMol and VMD are capable of reading the default-format files, and, to save disk space, CNS format files are not generated unless specifically specified using the above command.
Running this command will create CNS format FragMap files in the
silcs_fragmap_<protein PDB>/maps directory. It will also create the
file silcs_fragmap_<protein PDB>/view_maps.svl. First, copy the entire
silcs_fragmap_<protein PDB> directory from your server to a convenient
location on the desktop or laptop machine where you will be doing the
visualization. For example, on Linux or MacOS, you may use a command like
scp -rp silcsbio@silcsserver:~/silcsbio/projects/silcs.5tGP/silcs_fragmaps_3fly_fixed ~/Desktop
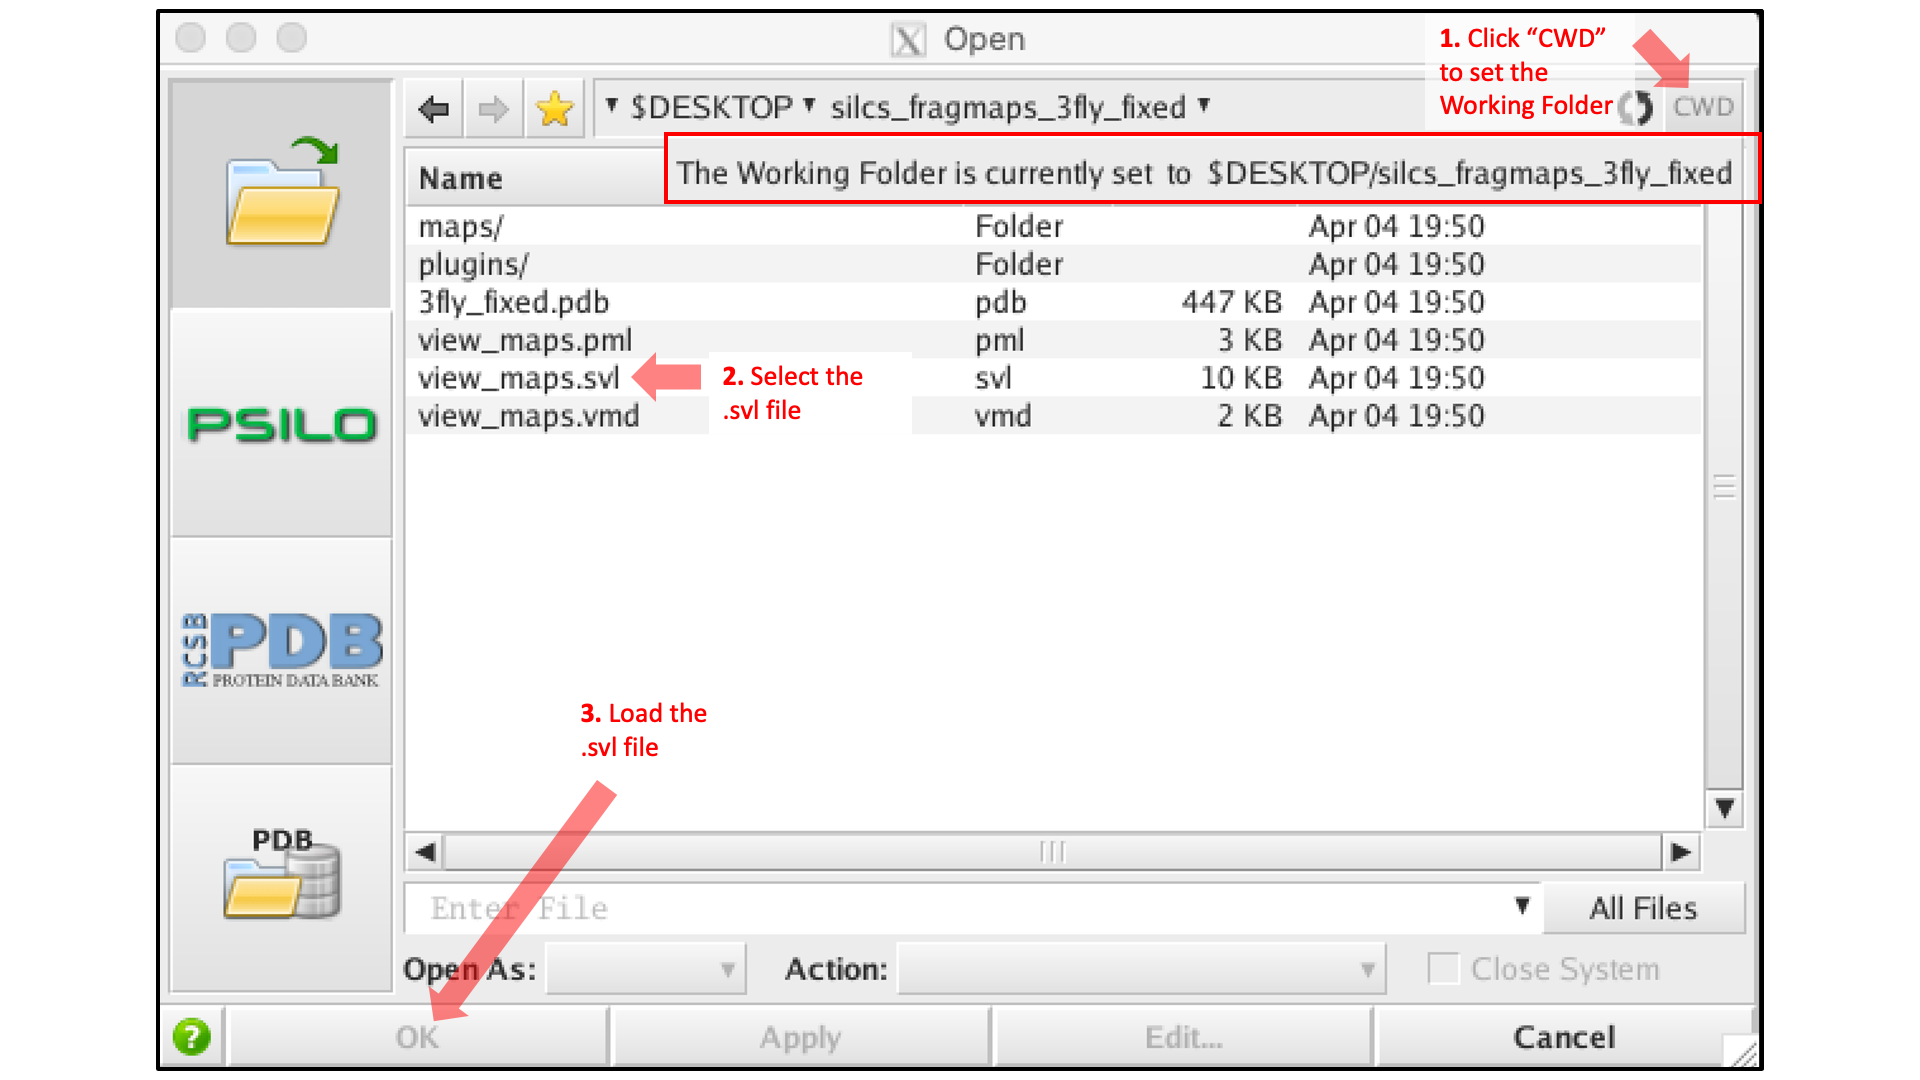
Then, use MOE to open the silcs_fragmap_<protein PDB>/view_maps.svl file
by selecting , which will bring up the
“Open” window. In this window, browse to the silcs_fragmap_<protein PDB>
directory, which, in this example, was downloaded from the server to the
Desktop of the machine on which we are doing the visualization. Click the
“CWD” button in the upper right corner to set this directory as the
“Working Folder.” Then, select the view_maps.svl file and click
the “Open” button:
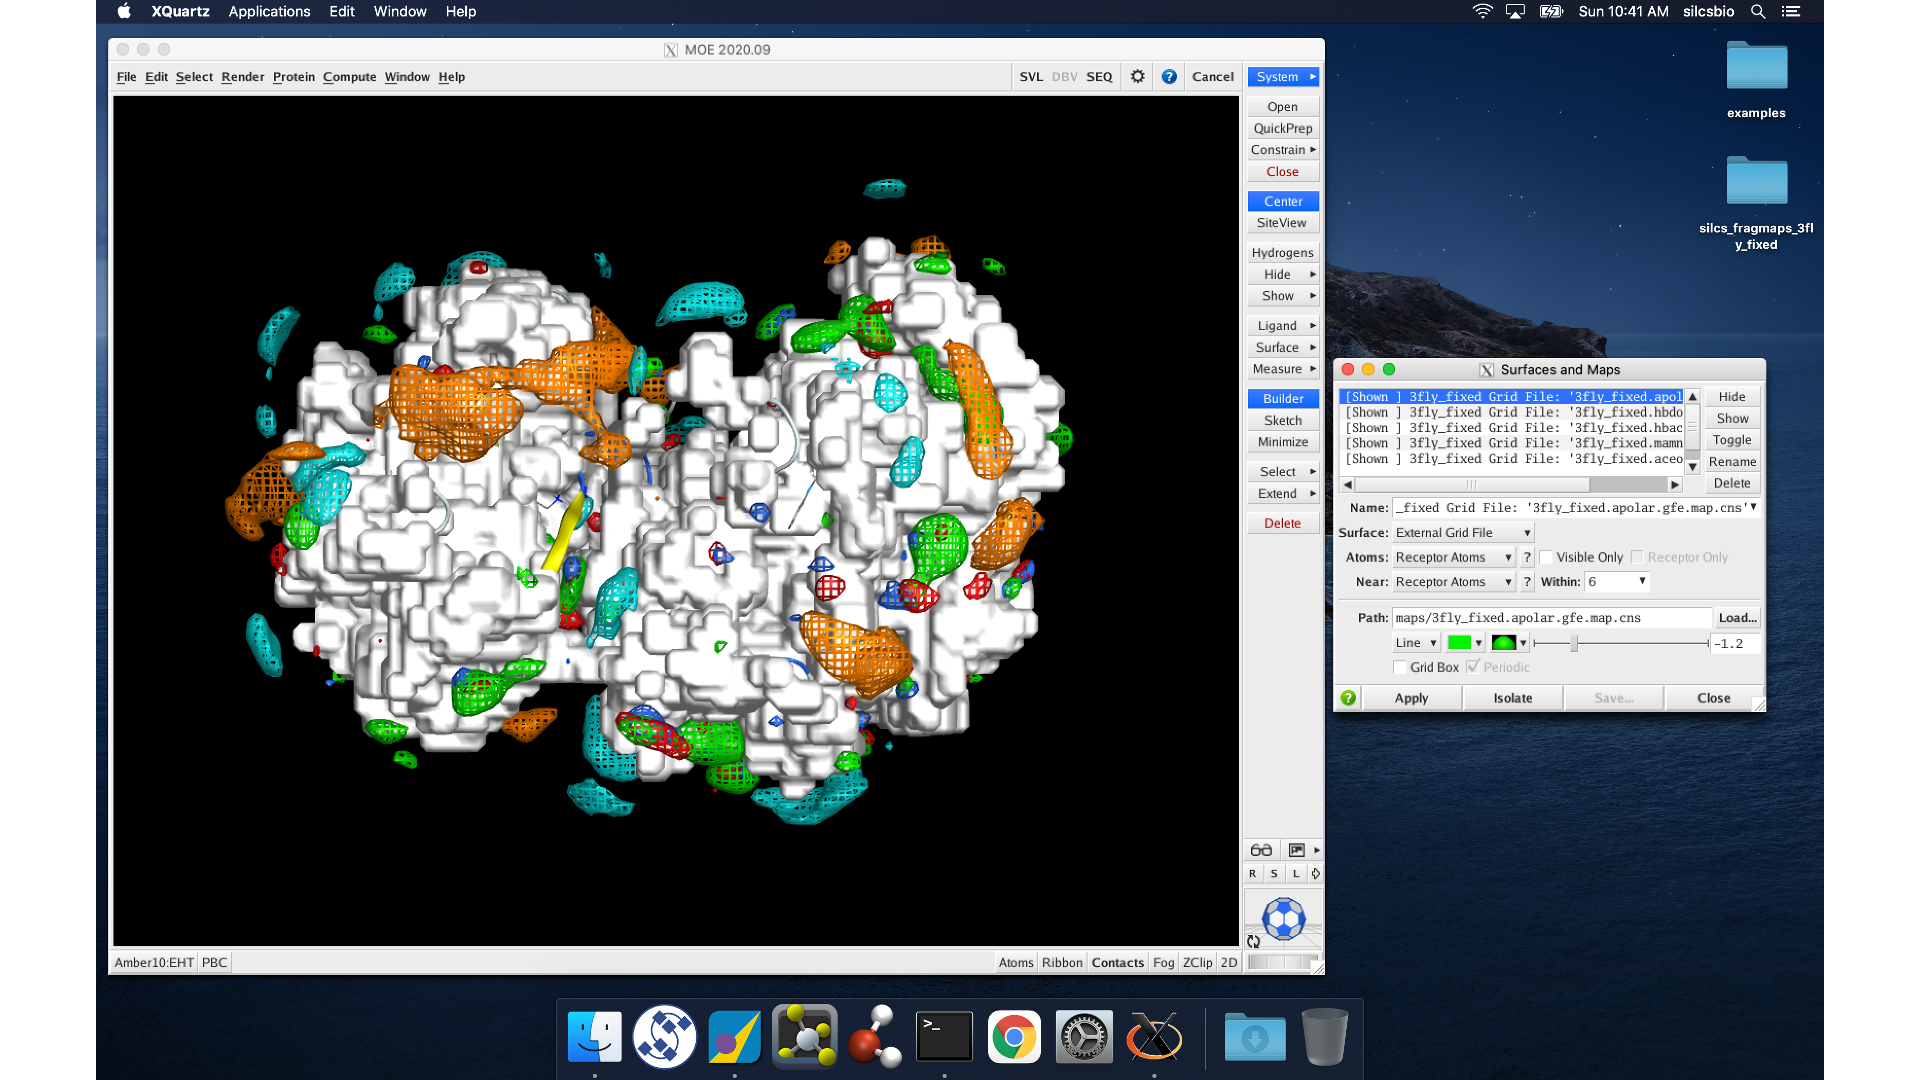
MOE will process the view_maps.svl file to load your input
PDB structure <protein PDB>.pdb used for the SILCS simulations, the
CNS format FragMap files <protein PDB>.<fragmaptype>.map.cns, and the
Exclusion Map <protein PDB>.excl.map.cns. The visualization of the
FragMaps and Exclusion Map can be controlled in the “Surfaces and Maps”
window, which is also automatically loaded by view_maps.svl.
FragMaps in PyMol
First, copy the entire silcs_fragmap_<protein PDB> directory from your
server to a convenient location on the desktop or laptop machine where you
will be doing the visualization. For example, on Linux or MacOS, you may
use a command like
scp -rp silcsbio@silcsserver:~/silcsbio/projects/silcs.5tGP/silcs_fragmaps_3fly_fixed ~/Desktop
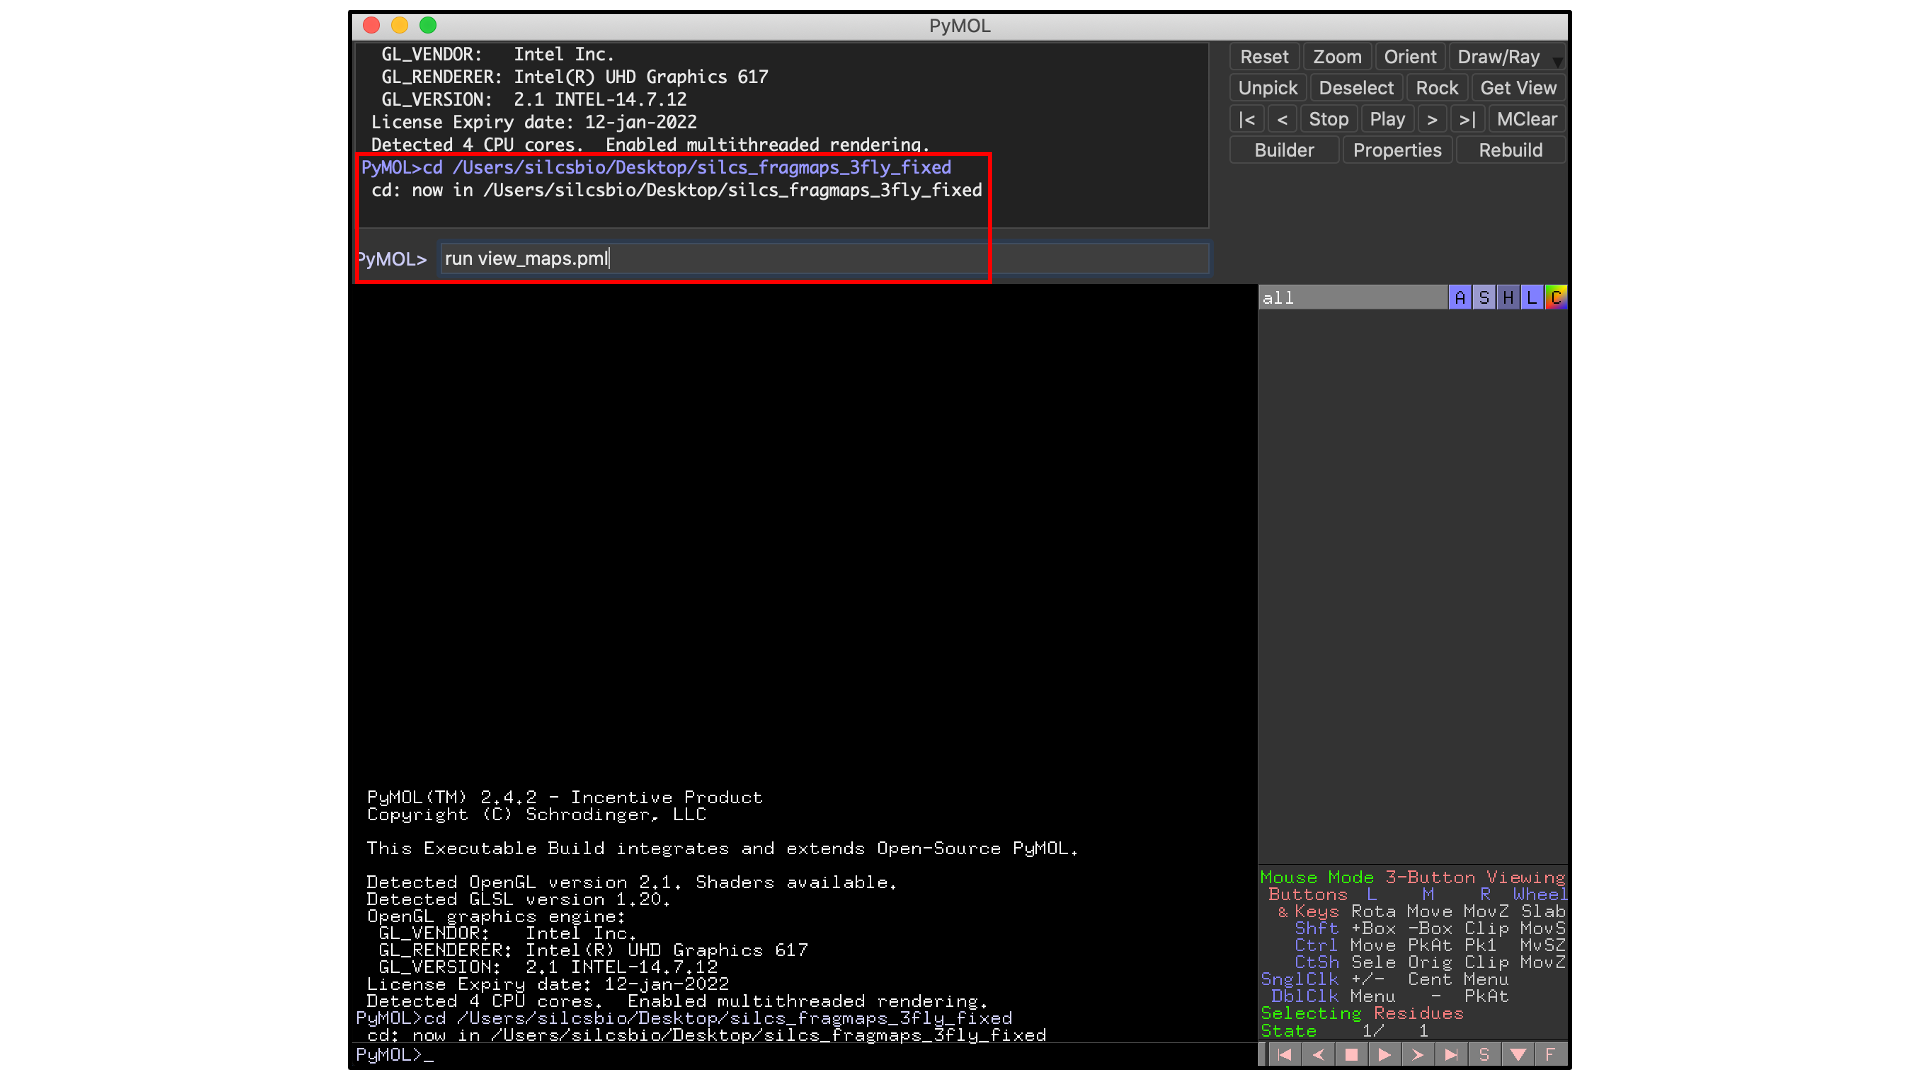
Open PyMol, then select , and open the
view_maps.pml file located within the silcs_fragmaps_<protein PDB>
folder. It is also possible to do this by typing commands into the PyMol
console. For the silcs_fragmaps_3fly_fixed example here, the
commands would be
cd /Users/silcsbio/Desktop/silcs_fragmaps_3fly_fixed
which sets the working directory, and
run view_maps.pml
which runs the view_maps.pml file in that directory.
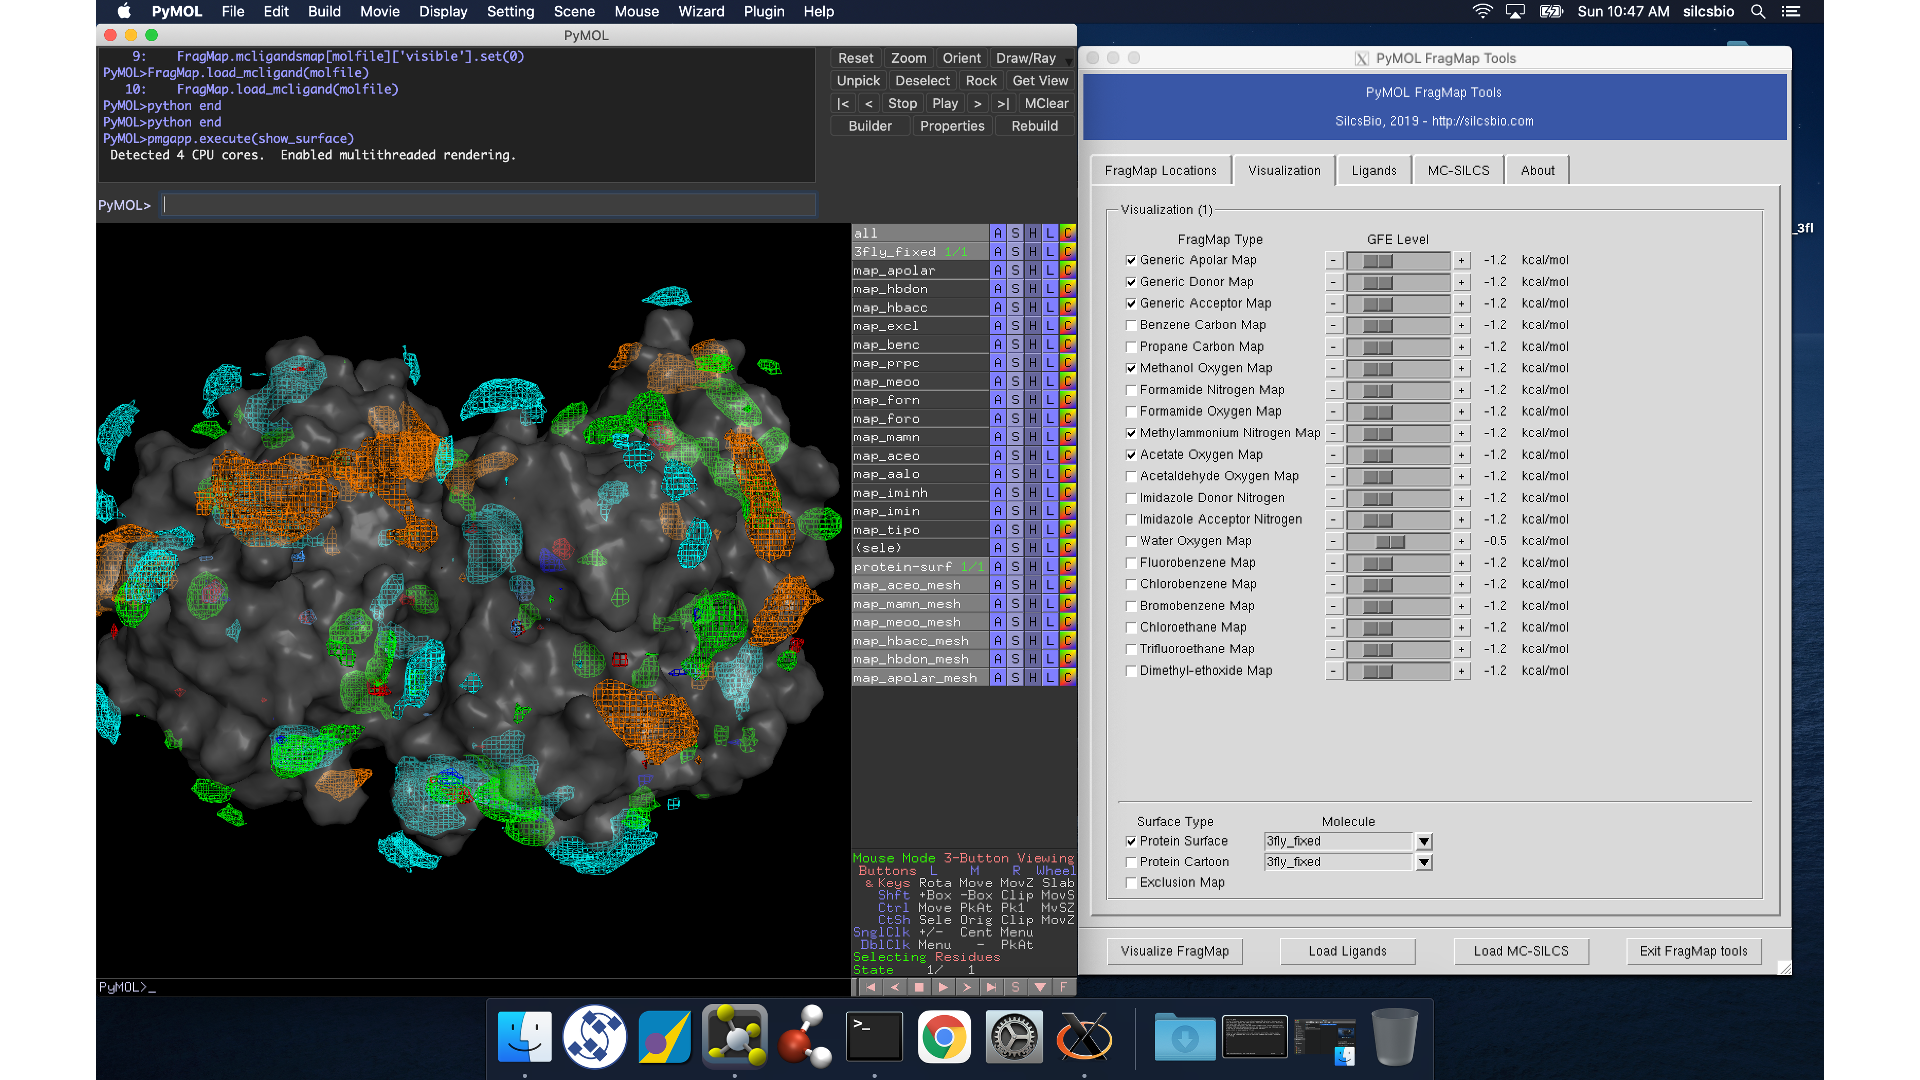
Whichever of these two methods you use to load view_maps.pml,
PyMol wil load the PDB structure <protein PDB>.pdb used for the SILCS
simulations, the FragMap files, and the Exclusion Map. The visualization of
the FragMaps and Exclusion Map can be controlled in the “PyMol FragMap
Tools” window, which is also automatically loaded by view_maps.pml.
Warning
If your operating system associates the .pml extension with PyMol, it
is possible simply to double click on the view_maps.pml file in the
silcs_fragmaps_<protein PDB> folder. However, PyMol may fail to open
multiple FragMaps. Specifically, if you are opening two different FragMaps
having the same protein name, using double clicking to open
view_maps.pml will result in the first FragMap being loaded again
instead of the second one. Doing will
direct you to provide the correct path for the second FragMap set.
FragMaps in VMD
First, copy the entire silcs_fragmap_<protein PDB> directory from your
server to a convenient location on the desktop or laptop machine where you
will be doing the visualization. For example, on Linux or MacOS, you may
use a command like
scp -rp silcsbio@silcsserver:~/silcsbio/projects/silcs.5tGP/silcs_fragmaps_3fly_fixed ~/Desktop
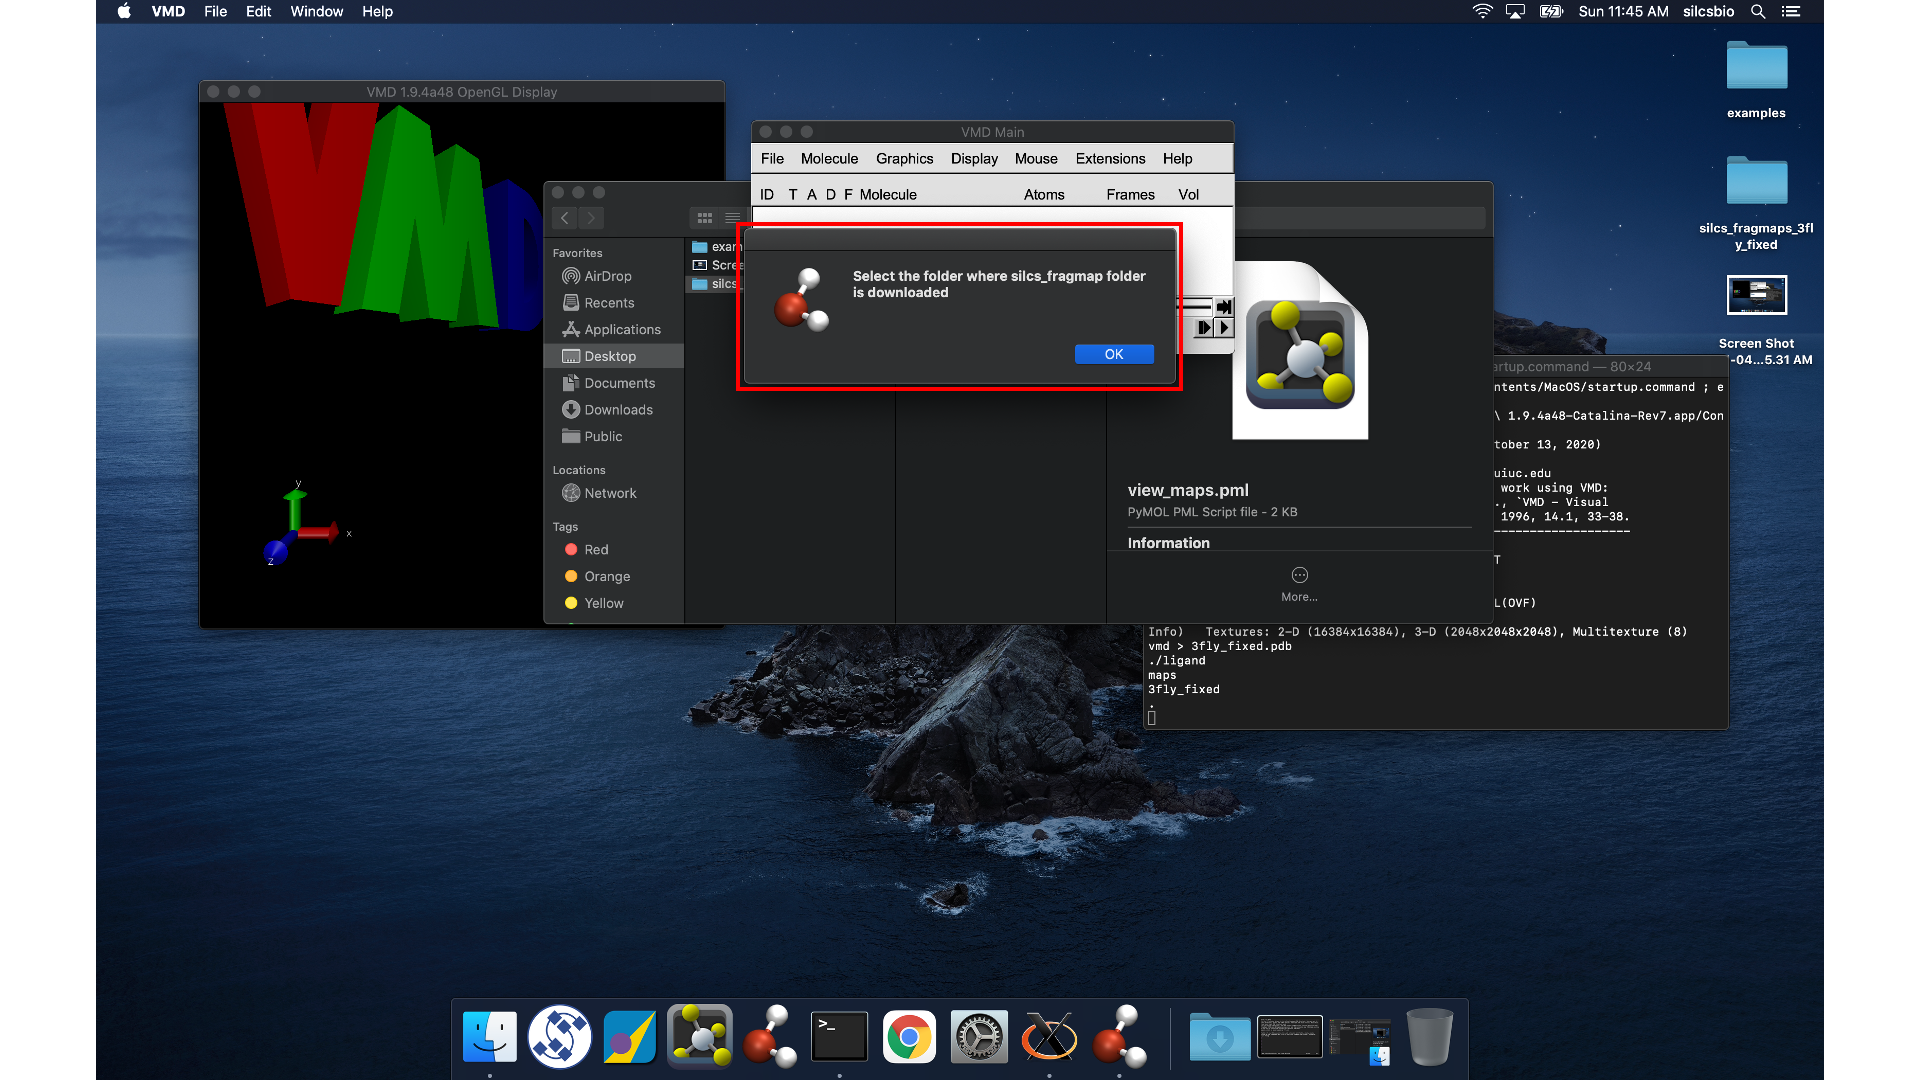
Open VMD, select , and
open the view_maps.vmd file located in the silcs_fragmap_<protein PDB>
directory you downloaded. A new window will pop up that says, “Select
the folder where silcs_fragmap folder is downloaded”. Click the “OK”
button and select the silcs_fragmap_<protein PDB> you downloaded.
Tip
Be careful to select the silcs_fragmap_<protein PDB> folder and
NOT the silcs_fragmap_<protein PDB>/maps folder.
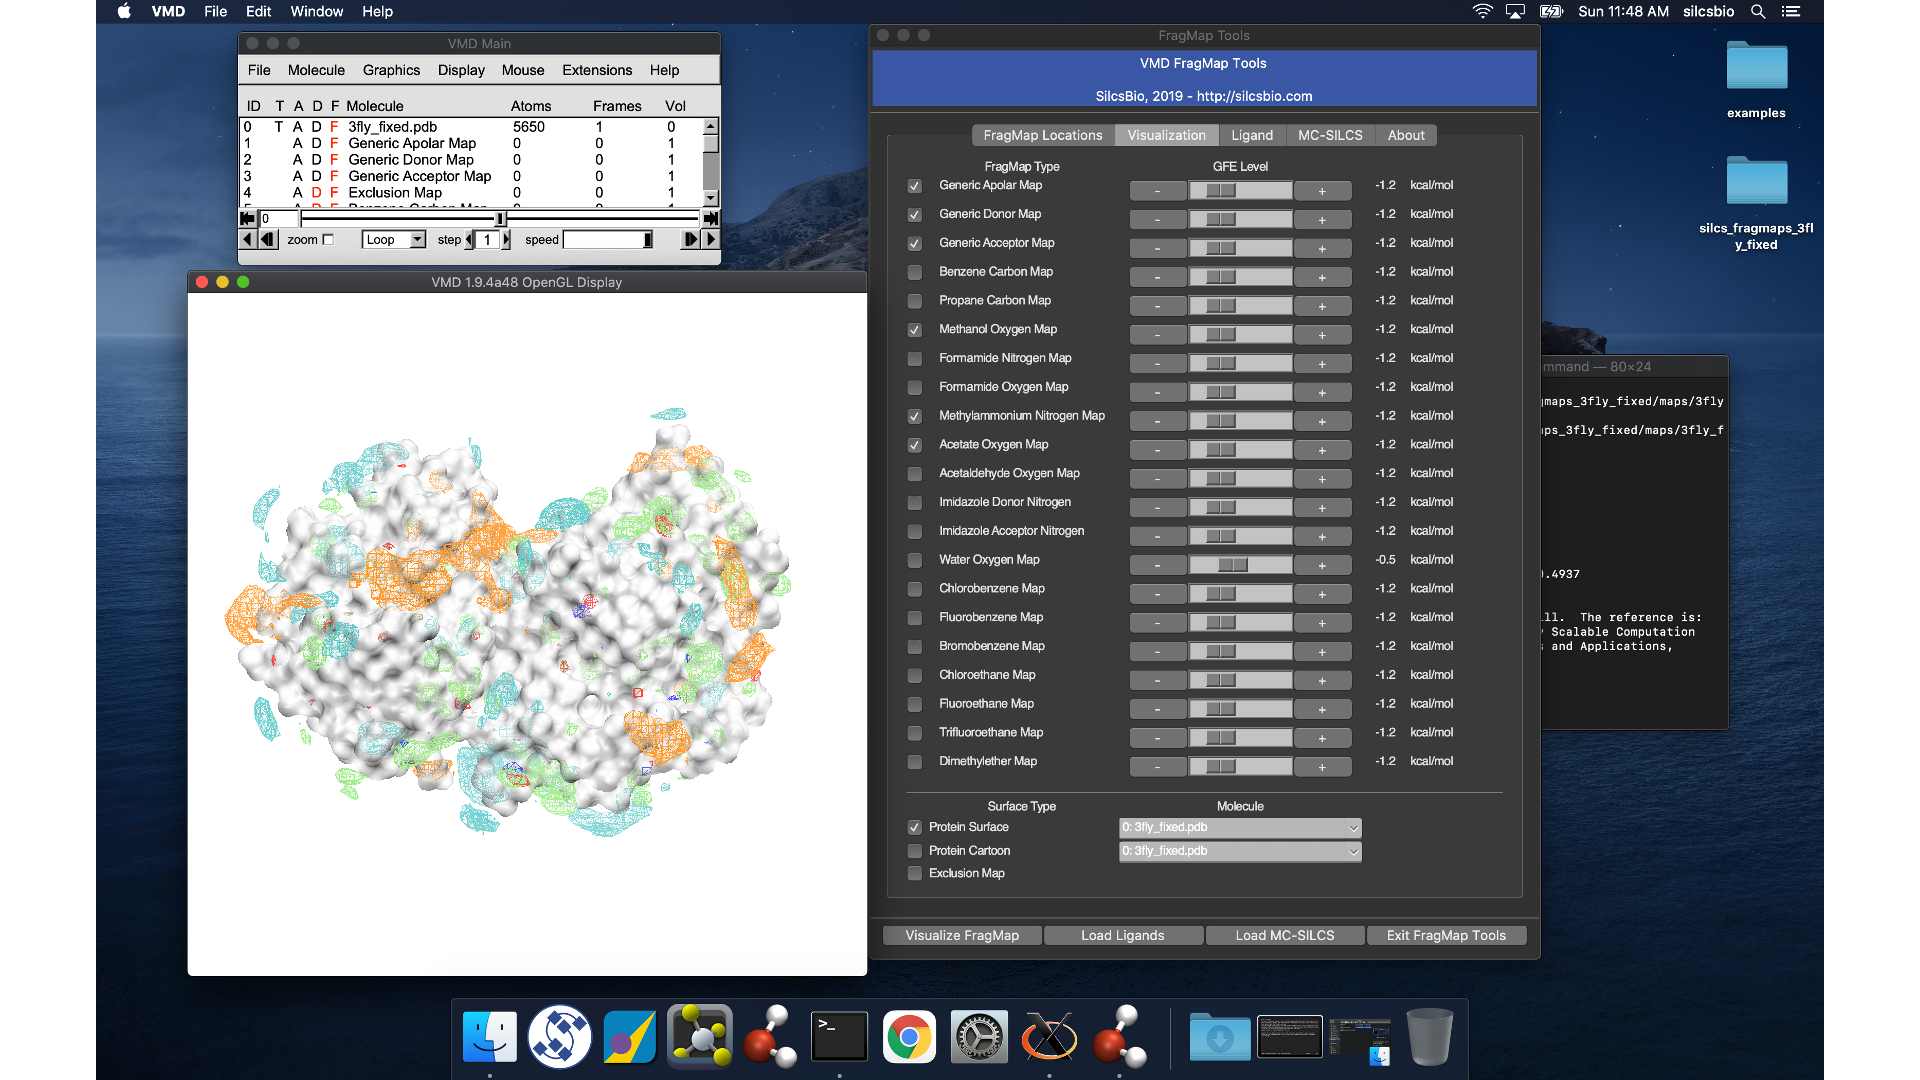
VMD wil load the PDB structure <protein PDB>.pdb used for the SILCS
simulations, the FragMap files, and the Exclusion Map. The visualization of
the FragMaps and Exclusion Map can be controlled in the “VMD FragMap
Tools” window, which is also automatically loaded by view_maps.vmd.
Note
VMD (version 1.9.4 or older) does not read .map files correctly. It shifts the grid map by 1.73 angstrom. Visualization in PyMol is preferred.